Custom ecommerce analytics dashboard with Power BI
Ntara helps clients integrate ecommerce and sales performance data to create a custom analytics dashboard in Power BI.

The challenge:
Bridging the analytics gap
Royal Brass and Hose is a leading provider of industrial supplies and components. They faced a common challenge in the digital age—the siloed nature of their analytics data. Their website and ecommerce analytics were scattered across different platforms, making it difficult to gain a holistic view of their online performance. With a desire to make data-driven decisions, Royal Brass and Hose turned to Ntara for a solution that could unify and help them visualize their data effectively.
Our approach:
Data visualization mastery
Power BI helps ecommerce companies stay connected with their data. It not only provides a comprehensive view of business operations. It also empowers them to make data-driven decisions, adapt to market changes, and achieve sustained growth in the highly dynamic world of ecommerce.
So, we embarked on a three-phased mission to equip Royal Brass and Hose with actionable insights:
- Data integration
We began by connecting Royal Brass and Hose’s disparate data sources, including website analytics using Google Analytics 4, SEO data, sales data, and ecommerce metrics into a central repository. This process involved integrating APIs, configuring data connectors, writing custom SQL code, and ensuring data synchronization. - Power BI dashboard development
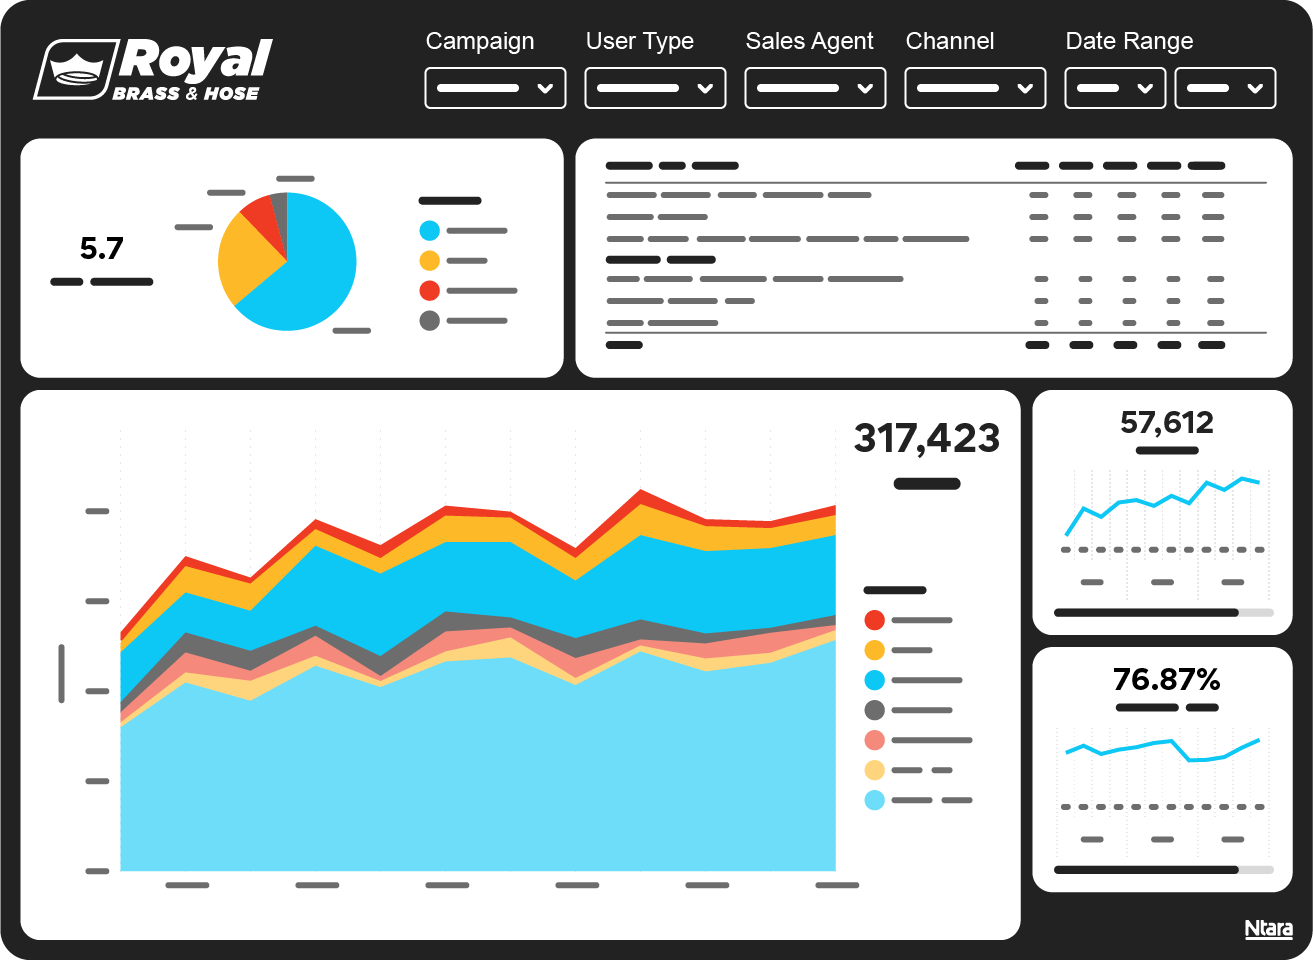
Our team designed a customized PowerBI dashboard to highlight different performance analytics, from user behavior on the site to organic and SEO insights to product conversion data by customer. The multi-page dashboard seamlessly combined various data sources into a visually appealing and intuitive interface. - Advanced data visualization
Our team created interactive, dynamic visual elements that allow Royal Brass and Hose to explore their data and segment it by key personas. We made their critical metrics more visible, such as sales trends, contact form submissions, unique logins, and revenue evolution over time. This helps them analyze campaign-specific metrics to learn which strategies are driving success.
Final results:
Empowering informed decision-making
The ecommerce analytics dashboard comprises a variety of dedicated sections, each designed to deliver substantial value. Here’s a breakdown of how each section empowers the team at Royal Brass and Hose:
Sales dashboard
This section provides a comprehensive view of sales performance. Royal Brass and Hose can monitor revenue, sales trends, and key metrics at a glance – facilitating the adaptation of strategies and ensuring revenue growth.
Website analytics
This is the pulse of Royal Brass and Hose’s online presence, providing real-time insights into website traffic, user behavior, and engagement metrics. It allows them to assess overall website health and identify trends, creating data-driven decisions to enhance user experience and drive conversions.
Product performance
Tracking product performance is critical for any ecommerce business. This section provides a comprehensive view of product sales, and customer preferences, empowering Royal Brass and Hose to optimize their product catalog, pricing, and promotions for increased sales and profitability.
Campaign explorer
Clarity on the ROI of marketing campaigns is essential. This page enables Royal Brass and Hose to assess campaign performance, allocate resources to the most effective campaigns, and refine strategies for improved results.

Google My Business
Local SEO and visibility play a critical role in attracting nearby customers to Royal Brass and Hose’s local stores across the U.S. These custom visualizations and data tables help their team monitor their Google My Business listing’s performance, managing customer reviews, and enhancing their local presence to increase foot traffic.
Search engine optimization
Improving search engine visibility and rankings is a top priority. This section of the dashboard empowers Royal Brass and Hose to enhance their SEO efforts by monitoring keyword performance, tracking backlinks, and optimizing their content for better organic search results.
Page explorer
This section precisely tracks the performance of specific web pages, channels, and bounce rates. It’s a flexible tool for exploring any page or section of the site. As such, it allows Royal Brass and Hose to optimize content and user experience to enhance engagement and reduce bounce rates.
By the numbers
20%
YOY growth in online revenue
75%
unassisted revenue (self-served revenue not requiring sales resources)
7
custom pages of website analytics for ecommerce insights
Through this project, Royal Brass and Hose gained access to a unified analytics ecosystem that offered insights previously hidden in data silos. They now have a single source of truth for all their online performance analytics, enabling them to make data-driven decisions with confidence.
Request a quote